
What has been published around a postcode district?
See annual totals, monthly change and offence mix for a postal area without presenting it as an exact-address history.
Check crime by postcode →
Explore privacy-protected police-recorded crime, then use postcode reports, defined-area comparisons and national statistics without losing the source limitations.
A postcode, map point, local-authority rate and national statistic are different kinds of evidence. Choose the view that matches the question.
See annual totals, monthly change and offence mix for a postal area without presenting it as an exact-address history.
Check crime by postcode →Filter privacy-protected locations by source month and offence group, then open the published outcome where one exists.
Explore the crime map →Compare the same category and 12-month period using either record counts or rates per 1,000 residents.
Compare local authorities →Use national releases for homicide, demographics and questions that the broad street-level categories cannot answer.
Browse UK crime reports →These are deduplicated official street-level records for 2024-03. The source supplies a month, not an incident day, so the daily figures are calendar-day averages calculated from 31 days.
The chart uses the latest complete source month. It shows the mix of published record categories - Not the chance of becoming a victim.
Only the five largest groups are shown here. Browse all 14 published crime types, or open the map to filter every offence group and change the source month.
The source month and privacy warning stay next to the map. Filters change the evidence you see; they do not turn a raw count into a crime rate.
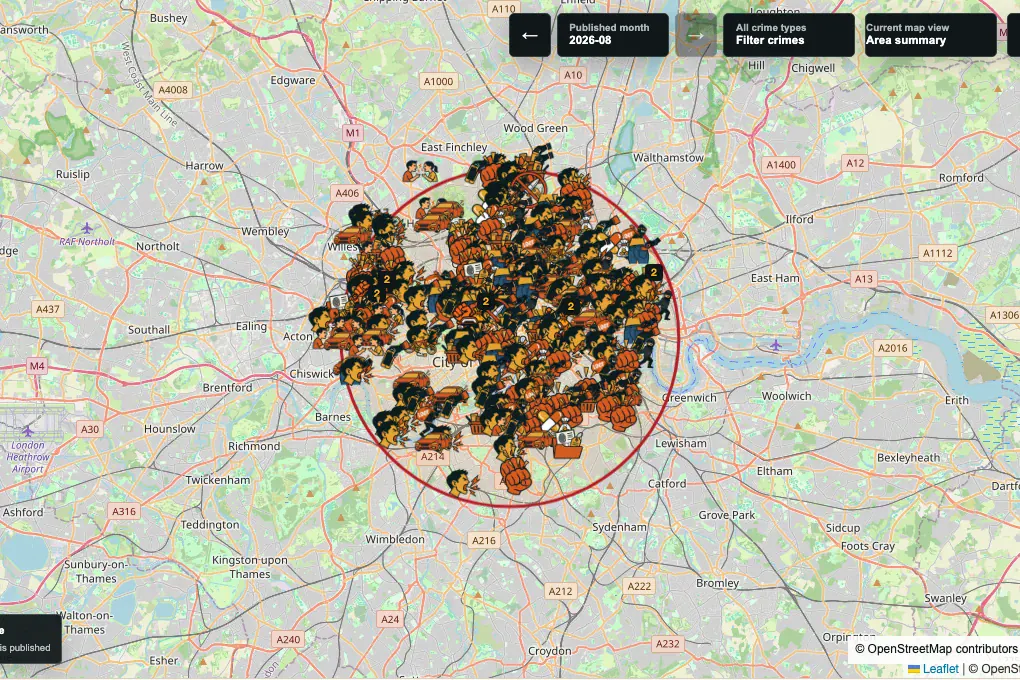
Learn how to interpret anonymised street-level crime map points, source months, outcomes and reporting gaps without treating them as exact addresses.
Read this guide →Compare street-level records, police-recorded crime and the Crime Survey for England and Wales, including what each source measures and omits.
Read this guide →Use this practical checklist to compare UK area crime rates by offence, period, population and coverage without mistaking record counts for personal risk.
Read this guide →We show where each dataset fits instead of blending unlike figures into one dramatic number.
For a place, start with crime by postcode or compare defined areas in the local-authority crime rankings. For national evidence, browse the UK crime reports and crime and demographic statistics. If the question concerns an offence rather than a statistic, use the reviewed UK criminal-law guides.
Read how CrimeRate approaches public crime data or check the publication and correction standard.
Short answers to the limits that matter before using a map marker or rate.
The street-level map covers published records for England and Wales. Scotland uses a different territorial source, and Greater Manchester is shown as a coverage gap because GMP has not supplied this dataset since July 2019.
No. Published locations are moved to nearby anonymous points. A marker can represent more than one record and must not be read as an exact crime scene or address history.
A count is the number of published records. A rate divides a count by a matching population estimate. Rates improve area comparison, but resident populations do not include commuters, shoppers or visitors.
The street-level source is published by month. CrimeRate currently identifies 2024-03 as the latest complete source month and labels older or incomplete evidence separately.